

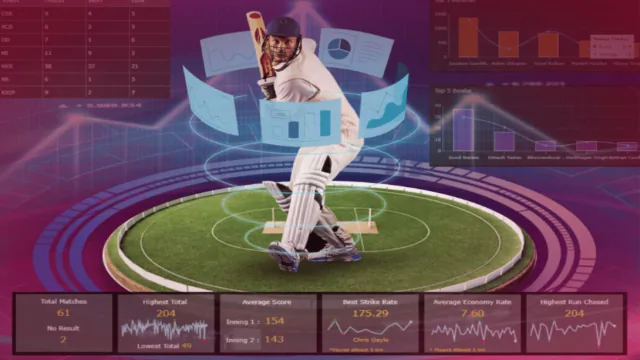
Cricket has always loved numbers, but modern teams have taken that obsession to another level. Today, franchises and national sides collect data from every delivery, shot, sprint, and fielding movement to improve decision-making.
Analysts work alongside coaches, helping teams identify hidden strengths and weaknesses that traditional scouting might miss. What once required instinct is increasingly supported by evidence.
Even fans following matches through platforms such as RajBet India regularly encounter advanced statistics that were once available only inside professional dressing rooms. Modern cricket is becoming a game where information can be almost as valuable as talent.
Turning Every Ball Into Information
One of the biggest changes in cricket over the last decade is the shift from simple statistics toward contextual analysis. Teams no longer focus only on batting averages or wicket totals. They want to understand when performances happen, against whom, and under what conditions.
This approach helped England rebuild its white-ball strategy after the disastrous 2015 Cricket World Cup.
Analysts found that successful teams were scoring more aggressively during Powerplays and accepting higher risks in exchange for greater scoring potential. England embraced the data-driven approach and eventually won the 2019 Cricket World Cup.
Core Performance Metrics Used by Modern Teams
| Metric | How Teams Use It |
| Strike Rate | Measures runs scored per 100 balls. Analysts break it down by match phase because a strike rate of 150 during Powerplay overs has different value than the same rate at the end of an innings. |
| Batting Average | Still important for measuring consistency, but modern teams combine it with scoring speed and opposition quality before making player evaluations. |
| Boundary Percentage | Shows how often a batter scores fours and sixes. High boundary rates are especially valuable in T20 cricket where quick scoring is critical. |
| Dot Ball Percentage | Tracks deliveries that produce no runs. Batters try to reduce dot balls while bowlers aim to increase them and create pressure. |
| Economy Rate | Measures runs conceded per over. Teams often evaluate economy separately during Powerplays, middle overs, and death overs. |
| Bowling Strike Rate | Indicates how frequently a bowler takes wickets. A bowler who removes batters regularly can be more valuable than one with a slightly better economy rate. |
| Powerplay Efficiency | Measures performance during the first six overs when fielding restrictions create scoring opportunities and tactical pressure. |
| Death Overs Performance | Evaluates effectiveness in overs 16-20, where matches are often won or lost in T20 competitions. |
| Catch Conversion Rate | Tracks how often fielding opportunities become successful catches, helping teams evaluate defensive reliability. |
| Expected Match Impact | Advanced models estimate a player's overall influence on winning probability rather than relying on traditional scorecards alone. |
These numbers rarely exist in isolation. Teams combine them to create player profiles that reveal strengths invisible to casual observers.
That is why a batter averaging 35 can sometimes be considered more valuable than one averaging 45. Context often matters more than raw totals.
Questions Analysts Ask Before Every Match:
- Which batter scores most effectively against left-arm pace?
- Which bowler performs best against aggressive opening batters?
- What delivery length produces the highest dismissal rate on this pitch?
- Which field placements save the most runs against specific opponents?
- How does dew affect bowling effectiveness in evening matches?
- Which player handles pressure situations most successfully?
- What happens to scoring rates after early wickets?
- Which bowling combinations work best together?
- How important is winning the toss at this venue?
- Which tactical matchups provide the greatest advantage?
The answers to these questions help coaches prepare far more detailed game plans than were possible a decade ago.
Analytical preparation does not guarantee victory, but it significantly reduces uncertainty before matches begin.
Understanding Opponents Better Than They Understand Themselves
If the first stage of analytics focuses on your own players, the second focuses on opponents. Modern teams build detailed reports covering every likely matchup before major tournaments and franchise leagues.
A famous example comes from analyst Prasanna Agoram, whose work with South Africa involved extensive batter-versus-bowler analysis. Rather than viewing opponents as complete players, analysts break them into dozens of measurable tendencies. Every weakness becomes a potential opportunity.
Technologies Driving Modern Cricket Analytics
| Technology | Practical Application |
| Hawk-Eye | Tracks ball trajectory, bounce point, swing, seam movement, and release position for tactical analysis. |
| CricViz Databases | Provide access to millions of historical deliveries for matchup and performance research. |
| GPS Wearables | Monitor workload, sprint distance, and recovery levels during training and matches. |
| Video Analysis Software | Allows coaches to review technical patterns frame by frame. |
| AI Models | Identify trends and performance patterns that may not be visible through manual analysis. |
| Win Probability Models | Estimate a team's chances of victory after every delivery. |
| Biomechanical Sensors | Help monitor bowling actions and reduce injury risks. |
| Tracking Cameras | Measure fielding positions, movement efficiency, and reaction speed. |
| Visualization Dashboards | Convert complex datasets into simple reports for coaches and players. |
| Simulation Systems | Test tactical decisions before matches are actually played. |
Technology has become so important that many franchises now employ dedicated analytics departments alongside traditional coaching staffs.
The objective is not to replace experience. The objective is to support experience with evidence.
What Teams Commonly Study About Opponents:
- Scoring zones against pace bowling.
- Scoring zones against spin bowling.
- Preferred shots during Powerplays.
- Weaknesses against short-pitched deliveries.
- Performance against left-handed batters.
- Results under scoreboard pressure.
- Strike rotation efficiency.
- Boundary frequency in different conditions.
- Decision-making during run chases.
- Historical performance at specific venues.
Interestingly, this same information indirectly influences betting markets. Odds makers and prediction models often rely on many of the same trends professional teams study.
For fans using RajBet, live odds movements frequently reflect matchup information, player availability, venue history, and scoring patterns long before commentators discuss them on television.
Tactical Factors Frequently Modeled by Teams
| Tactical Factor | Why It Matters |
| Toss Outcome | Certain venues show measurable advantages for batting or bowling first. |
| Venue History | Some grounds consistently produce higher scoring rates than others. |
| Pitch Deterioration | Surface changes can significantly alter batting conditions later in matches. |
| Dew Impact | Evening moisture often affects spin bowling and ball control. |
| Matchups | Certain bowlers consistently outperform specific batters. |
| Field Placements | Data identifies positions that save the greatest number of runs. |
| Bowling Rotation | Over allocation can influence scoring patterns during key phases. |
| Powerplay Strategy | Early decisions often shape the rest of an innings. |
| Run-Chase Models | Teams estimate required scoring rates under different scenarios. |
| Weather Conditions | Wind, humidity, and cloud cover can affect swing and scoring. |
By combining these variables, teams create tactical plans that are far more detailed than simple intuition could provide.
The modern dressing room often looks as much like a strategy department as a sporting environment.
Analytics Beyond Match Day
Perhaps the most fascinating use of analytics happens before players even step onto the field. Recruitment, injury prevention, and long-term squad planning have become major areas of investment across international cricket and franchise leagues
The IPL offers some of the strongest examples. Teams increasingly evaluate players according to specific roles rather than overall reputation. A batter might be selected primarily because of exceptional performance during overs 16-20, while a bowler may be targeted specifically for Powerplay effectiveness.
Areas Where Analytics Influences Recruitment
| Area | How Analytics Helps |
| Talent Identification | Finds promising players before they become widely recognized. |
| Auction Planning | Estimates player value more accurately during bidding processes. |
| Squad Balance | Helps create combinations that cover different tactical situations. |
| Overseas Recruitment | Identifies international players suited to specific conditions. |
| Youth Development | Tracks progress and projects future potential. |
| Contract Decisions | Supports renewal and retention evaluations. |
| Role Assignment | Determines where players create maximum value. |
| Replacement Planning | Identifies suitable alternatives when injuries occur. |
| Risk Assessment | Evaluates consistency and reliability over time. |
| Long-Term Strategy | Aligns recruitment with future team objectives. |
Many franchises now search for undervalued skills rather than famous names. This approach resembles the famous Moneyball strategy that transformed baseball.
The goal is simple: spend resources more efficiently than competitors.
Key Health and Performance Indicators:
- Sprint distance covered during matches.
- High-intensity acceleration frequency.
- Bowling workload accumulation.
- Recovery speed between matches.
- Heart-rate response to exertion.
- Fatigue indicators during congested schedules.
- Training intensity levels.
- Injury recurrence probability.
- Movement efficiency metrics.
- Physical readiness scores.
Monitoring these indicators allows teams to identify warning signs before injuries become serious problems.
For fast bowlers especially, workload management has become one of the most valuable applications of sports science.
Performance Monitoring Metrics
| Metric | Purpose |
| Sprint Distance | Measures overall physical workload during matches and training. |
| Acceleration Events | Tracks explosive movements that contribute to fatigue. |
| Bowling Load | Helps prevent overuse injuries among fast bowlers. |
| Recovery Index | Assesses readiness for upcoming matches. |
| Heart Rate Monitoring | Evaluates physiological stress levels. |
| Fatigue Scores | Identifies potential performance decline. |
| Training Volume | Ensures workloads remain within safe limits. |
| Injury Risk Models | Estimate probability of future physical issues. |
| Match Intensity Data | Compares demands across different formats. |
| Movement Efficiency | Measures how effectively players use energy. |
The future of cricket analytics will likely involve even greater use of artificial intelligence, automated video analysis, and predictive modeling. Yet despite all technological advances, the best teams continue to understand an important truth: data improves decisions, but people still make them.
Numbers can explain a great deal about cricket. They just cannot replace the human element that makes the sport worth watching.
Conclusion
Performance analytics has become one of the most influential forces in modern cricket. Teams now use data to improve tactics, evaluate opponents, recruit talent, manage injuries, and maximize performance across entire seasons.
While statistics alone cannot win matches, they provide a powerful competitive advantage when combined with coaching expertise and player skill. The future of cricket will almost certainly be more data-driven, but success will still depend on how effectively teams turn information into action.











Disclaimer
Possible11 is a sports news and analysis platform designed purely for entertainment and educational purposes. All match previews, player insights, and team analyses are based on publicly available information and expert opinions. We do not promote or support betting, gambling, or real-money gaming in any form. Users are encouraged to enjoy our content responsibly and use it for informational purposes only.











Give Your Feedback