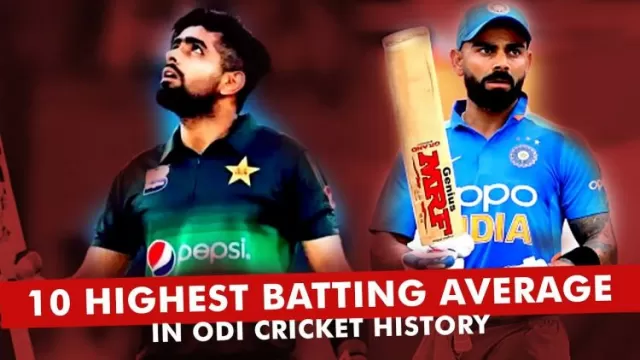
10 Cricketers Best Batting Averages in ODI Matches: In this article, we bring you ten batsmen who have done exceptionally well in ODIs, and managed 10 of the highest batting averages in history.
Top 10 Cricketers Best Batting Averages in ODI Matches
| S. No. | Team | Player | Span | Mat | Inns | Runs | HS | Ave | BF | SR | 100 | 50 | 4s | 6s |
|---|---|---|---|---|---|---|---|---|---|---|---|---|---|---|
| 1 | RN ten Doeschate | Netherlands | 2006-2011 | 33 | 32 | 1541 | 119 | 67.00 | 1757 | 87.70 | 5 | 9 | 130 | 29 |
| 2 | Shubman Gill | India | 2019-2023 | 24 | 24 | 1311 | 208 | 65.55 | 1224 | 107.10 | 4 | 5 | 149 | 28 |
| 3 | HE van der Dussen | South Africa | 2019-2023 | 45 | 39 | 1757 | 134 | 60.58 | 1959 | 89.68 | 4 | 11 | 129 | 30 |
| 4 | Babar Azam | Pakistan | 2015-2023 | 100 | 97 | 5088 | 158 | 59.85 | 5697 | 89.31 | 18 | 26 | 458 | 51 |
| 5 | Virat Kohli | India | 2008-2023 | 274 | 265 | 12898 | 183 | 57.32 | 13776 | 93.62 | 46 | 65 | 1211 | 138 |
| 6 | MG Bevan | Australia | 1994-2004 | 232 | 196 | 6912 | 108 | 53.58 | 9320 | 74.16 | 6 | 46 | 450 | 21 |
| 7 | AB de Villiers | South Africa | 2005-2018 | 228 | 218 | 9577 | 176 | 53.50 | 9473 | 101.09 | 25 | 53 | 840 | 204 |
| 8 | T Bavuma | South Africa | 2016-2023 | 26 | 25 | 1150 | 144 | 52.27 | 1255 | 91.63 | 4 | 3 | 104 | 16 |
| 9 | Imam-ul-Haq | Pakistan | 2017-2023 | 59 | 59 | 2719 | 151 | 51.30 | 3276 | 82.99 | 9 | 16 | 216 | 26 |
| 10 | Jonathan Trott | England | 2009-2013 | 68 | 65 | 2819 | 137 | 51.25 | 3658 | 77.06 | 22 | 5 | 216 | 3 |
Also Read: India ICC Test ranking Once Again Number 1

« Previous
RR vs SRH Impact Player, Playing 11, Match Preview, Pitch Report
Next »
KKR vs PBKS Impact Player, Playing 11, Match Preview, Pitch Report

Disclaimer
Possible11 is a sports news and analysis platform designed purely for entertainment and educational purposes. All match previews, player insights, and team analyses are based on publicly available information and expert opinions. We do not promote or support betting, gambling, or real-money gaming in any form. Users are encouraged to enjoy our content responsibly and use it for informational purposes only.












Give Your Feedback